Analysis:
With the ECB holding its first ‘listen’ talks with its citizens in Brussels, this could potentially bolster public confidence that their opinions are being heard. With the prolonged weakness in the Euro dollar against the backdrop of Brexit and 0% interest rate, this move may hopefully serve to boost the Euro dollar.
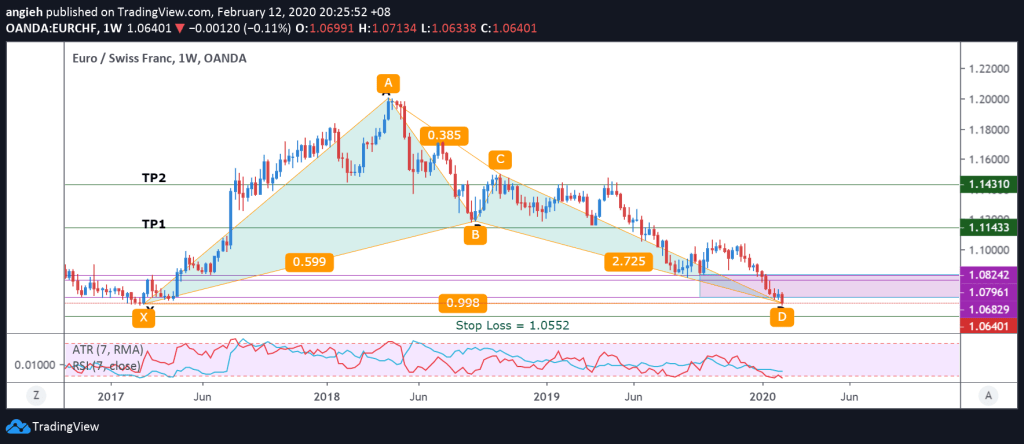
One possible bullish setup is seen in EURCHF weekly chart.
General Market Outlook:
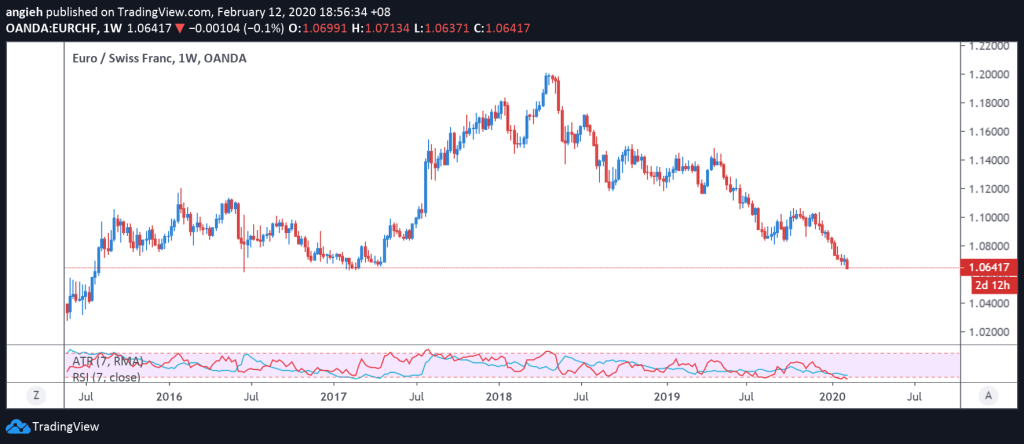
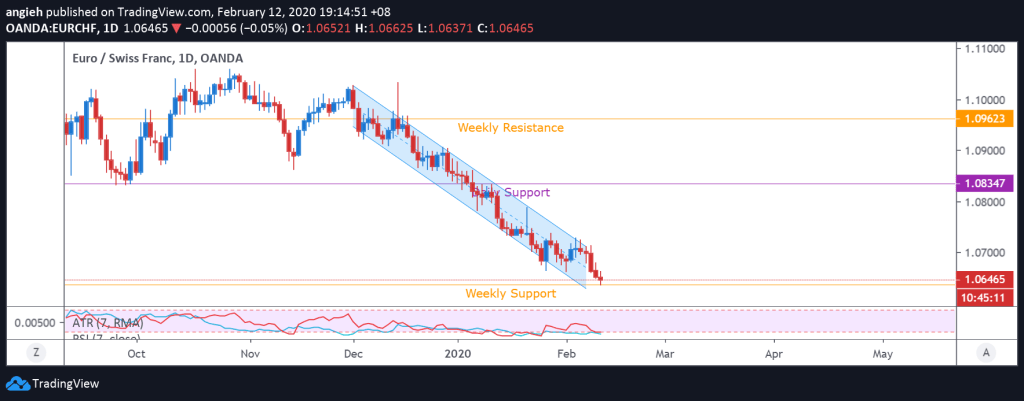
The EURCHF has been in a downtrend. Looking left, the current price has reached levels with tangible support levels. This may be proof that price will possibly bounce off with the help of ECB’s impending public opinion outreach. Below shows the Daily & Weekly Chart with the previous market structures and movement displayed.
Harmonic Pattern:
Bullish BAT-
Point X: 1.0642
Point B: 1.1181 (Fib retracement @ 0.618)
Point C: 1.1497 (Fib retracement @ 0.382)
Point D (PRZ):
– 1.0824 (Fib 0.886)
– 1.0796 (Fib 2.24)
– 1.0682 (Fib 2.24)
Entry:
Waiting for the next candle to hopefully cross back into the PRZ. Will trigger a trade at 1.0824 for the completion of BAT.
Stop loss:
X price + ATR (7) + 1 pip + Spread
= 1.0637 – 0.0082 – 0.0001 – 0.0002 = set at 1.0552
Take Profit Levels:
a) TP1 – Fib 0.382 : 1.1143
b) TP2 – Fib 0.618: 1.1431
Total Risk to Reward Level
TP1: 1.17 (still will take this level as it is executed at Weekly Chart)
TP2: 2.23
Trade Management:
Will only open a position depending on 2 factors:
a) Forming of the next candle must be a bullish one
b) RSI must rise above the Oversold level with the confirmation of a bullish candle
c) Completion of D by crossing all 3 levels within PRZ

